First Load (without using a debugger)
1.We won't be using a debugger for this part so do NOT set Debug Plug-ins Option in DigiView.
2.Create/enable signal
•click 'Config -> Signals' in DigiView
•Select your plug-in in the signal type list
•Click 'Add'.
•The plug-in will be loaded, enabled, and executed.
3.If you get error messages (other than timeouts):
•The plug-in will be unloaded
•The message will describe problems with the configuration string syntax.
•Make corrections, rebuild, and re-enable the signal until it loads without errors.
4.If you get TIMEOUT messages:
•The plug-in stopped responding and will be unloaded.
•See Using A Debugger below.
5.If the plug-in loads without error but doesn't parse correctly:
•The plug-in will remain loaded and active.
•Disable the signal to force unloading of the plug-in.
•See Using A Debugger below.
NOTE: you can not use F5 or 'Debug->Start Debugging' with a plug-in. You must invoke the plug-in with DigiView and then 'attach' the debugger to plug-in after it is running.
1.Set Debug Plug-ins Option in DigiView
2.Enable the Signal in DigiView.
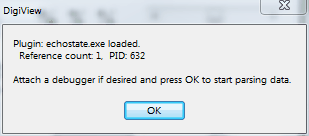
3.DigiView will load the plug-in and execute its onload(). The 'attach debugger' dialog will appear.
4. In Visual Studio, select 'Debug->Attach to Process'. If you don't see this option, you forgot to select 'Tools->Settings->Expert Settings' during Debug Setup.
5.Select your plug-in's name from the list and click 'Attach'
6.Open the plug-in source and set breakpoints. See Plug-in Data-flow for information on where you might want to set a breakpoint. You will probably put one at the start of parse() so you can look at variables to determine if the configuration variables were interpreted properly and then start debugging your actual parse() algorithms.
7.Dismiss the 'attach debugger' dialog. DigiView will start interrogating, configuring and streaming data to the plug-in until it hits a breakpoint or completes.
8.If the plug-in hits a breakpoint, DigiView will display a timeout dialog after 2 seconds. You can ignore this and continue single-stepping, viewing variables etc. until you run out of data. (see Streaming and Buffering). When the plug-in runs out of data or fills its output FIFO, it will hang in a loop in CmdParser(). Dismissing the timeout dialog will allow DigiView to absorb your plug-in's data and fill your input FIFO with more data to process. The timeout dialog will re-appear in about 2 seconds. These FIFOs are large so you could debug hundreds of samples before having to dismiss the dialog.
9.When you finish debugging, RUN to completion and dismiss timeout dialog. If DigiView appears to lock-up/freeze at this point, see the notes about Hidden Dialogs.
10.If changes are needed:
•Disable the signal & close its signal editor
•Edit and rebuild the plug-in
•Copy your plug-in to <DigiView's plugin directory> if not using Auto-Install
•Return to step 2 and repeat as needed.
11. If you run to completion and wish to breakpoint or step the entire process again (without rebuilding):
•Disable the signal in DigiView. This causes DigiView to unload the plug-in.
•Re-Enable the signal. This causes DigiView to reload the plug-in and run a full parse cycle.
12. If you just need to debug the parse() portion of the code again (without rebuilding):
•Open the signal editor and change one of the configuration items. This will skip the loading/unloading and calls to GetStrLits(). Each configuration change does a complete parse sequence.