Plotting Signal Data
DigiView can plot BUS, STATE, Protocol and Custom plug-in field values. NOTE: this does not imply DigiView does analog capture (like a scope). Rather, it allows you to visualize decoded digital VALUES. For example, the image below shows the LEFT and RIGHT channel fields from an I2S serial protocol capture.
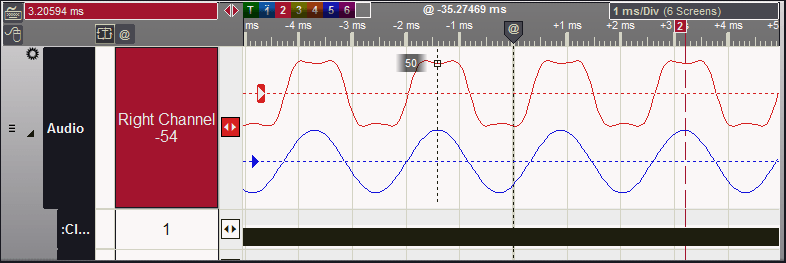
- When a signal is set to plot mode, it is shown in the waveform view as a graphical plot. All List views, searches and exporting continue to use numeric values.
- Up to 4 independent plots can be defined for each signal.
- Each plot can display all fields in a signal, or selected fields (like the 5th and 7th-10th fields of each frame.) In the example above, we defined 2 plots on the same signal. One plot selected the 1st field of each frame, and the other plot selected the 2nd field.
- The data can be interpreted as Unsigned, 2's Compliment, Sign & Magnitude, or Zero-Offset format.
Demo Video
Need more information?
Browse the left-hand menu, or choose one of of these shortcuts: PO Box 2408
Rowlett, TX 75030-2408
Rowlett, TX 75030-2408
voice: 972-272-9392
FAX: 972-494-5814
FAX: 972-494-5814
Copyright © 2022 TechTools. • TechTools, DigiView, ACM, ClearView, CVASM, EconoROM, FlexROM, QuickLoader, QuickWriter, TDE and UniROM are trademarks of TechTools, P.O. Box 2408 Rowlett, Texas 75030-2408 • PIC and PICmicro are registered trademarks of Microchip Technology Inc.
Continued use of this website indicates your acceptance of our Policies, including Terms of Use and Privacy.