While moving the mouse over any waveform a measurement is displayed directly above it (see Environment Settings: Waveform Views ). The type of measurement is dependent upon the signal type and the mouse position in the waveform. Vertical lines and arrows are displayed to indicate which edges are being measured. The measurements are calculated even if the beginning and ending points of the measured item are off-screen.
 Use this toolbar button to toggle Instant Measurements On/Off in a waveform view.
Boolean Example
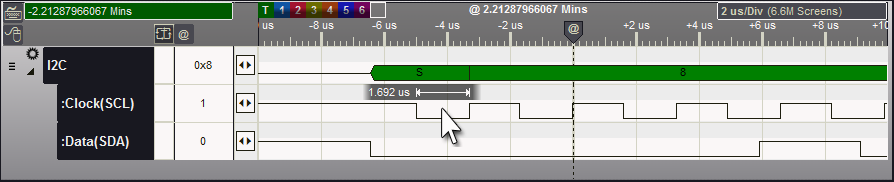
Mouse is between two edges so instant measurements calculates the time period between those edges. In the graphic below, the Period between the edges is 1.692 microseconds.
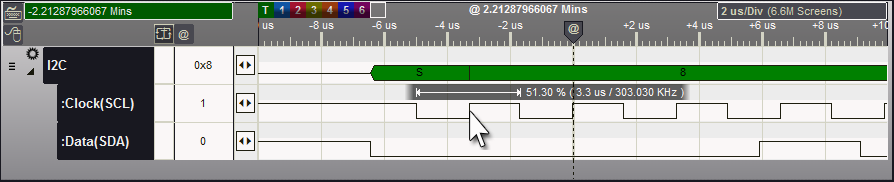
When the Mouse is on an edge, instant measurements uses the previous and next edge to calculate the duty between the edge under the mouse and the previous one. If this is a low period then Low Duty is represented, otherwise High Duty will be represented. In the graphic below, the Low Duty is 51.30%.
It also calculates the Period and Frequency from the previous edge to the next one as depicted by the arrows. In the graphic below, the Period is 3.3 microseconds and the Frequency is 303.030 KHz.
Example for Signals with Field and Frame data
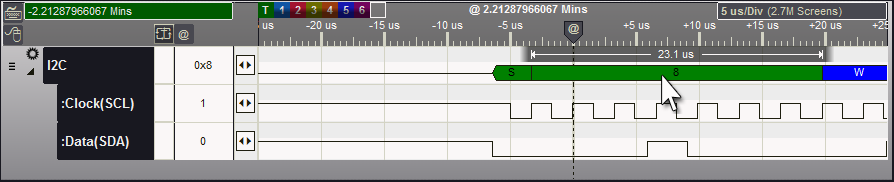
When the mouse is within the edges of a Field, the time period of the Field is calculated. In the graphic below, the Period for the Field under the mouse is 23.1 microseconds.
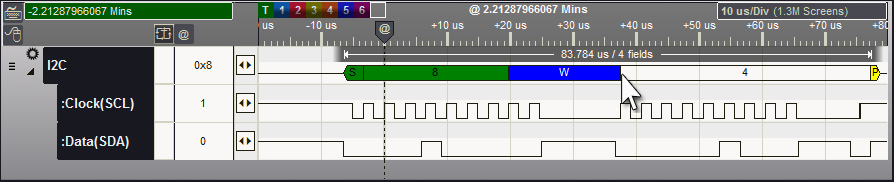
When the Mouse is on the edge of a field, instant measurements calculates the Period and Field Count of the Frame the Field belongs to. In the graphic below, the Period for the entire Frame is 83.784 microseconds and the Frame contains 4 Fields. The period and count are calculated even though the frame begins or ends off-screen.
Example for Signals with Plot Enabled
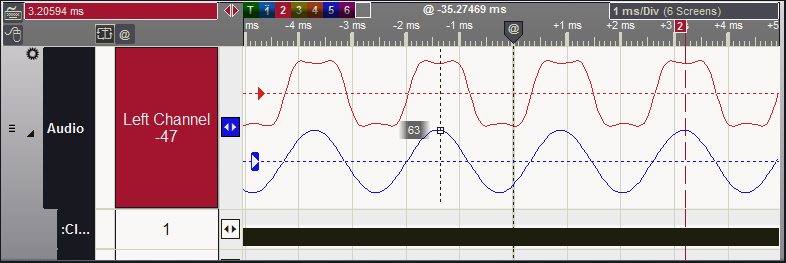
When a signal is in plotting mode, Instant Measurements will function on the Plot data and display the value of the plot at the mouse point. If multiple plots are enabled for the signal, Instant Measurements will function on the selected plot. Pressing the Space Bar will toggle the plot selection without having to move the mouse.
In the first graphic below, the bottom plot is being measured. This is identified by its plot handle being highlighted in the plot's color. The Signal Snap arrows in the next column are also the same color as the plot and the marker column displays the selected plot's identifier. These items will change to identify the active plot.
In this case we used "Left_Channel" and "Right_Channel" to identify the two enabled plots for the Audio signal. After pressing the space bar once, the second plot becomes active and instant measurements will track its values as displayed in the second graphic ("Right_Channel" plot is active).
After pressing the space bar, the other plot value is displayed while moving the mouse.
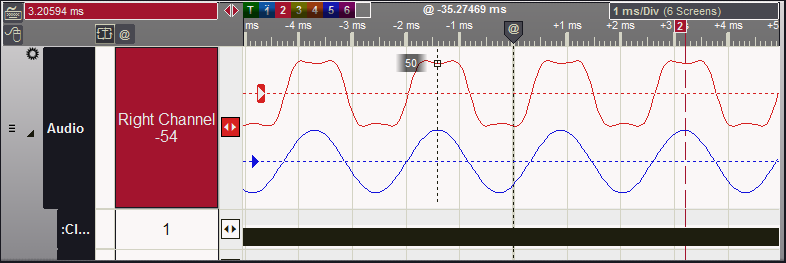
A dotted Vertical line is always drawn at the mouse point and a small square surrounds the point where this intersects with plotted data. The value at this intersection is displayed in the Instant Measurement.